Results
Plots
Chart responses against step, time or each other.
The plot button in the Display Results header opens a floating window that can be dragged, resized and maximised.
Presets
| Preset | Plots |
|---|---|
| Node displacement | Displacement of the selected nodes |
| Base shear | Sum of reactions, sign flipped |
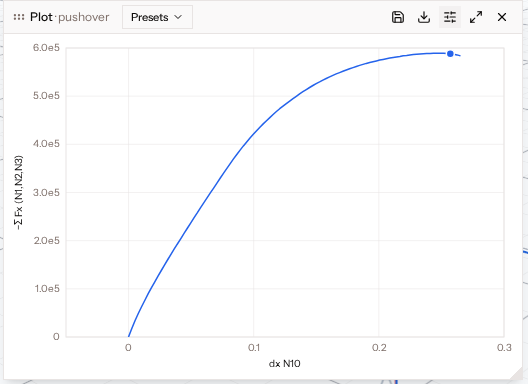
| Pushover | Base shear against control-node displacement |
| Moment–rotation hysteresis | Moment against rotation |
You can also add the selected nodes' displacements or clear all series.
Series
Each series has an X and a Y channel, a colour and a visibility toggle. A channel is the step, the time, or a response:
- Response kinds: displacement, velocity, acceleration, reaction, element force.
- A response has a component and a mode: a single node or element, or the sum or difference of several.
- A scale multiplies the values. Use −1 to flip sign, or 1/h to get a drift ratio.
Options include a shared X axis, stage tick marks and a current-step marker.
Saving and exporting
Save to report keeps the plot's configuration (see Report panel). Export CSV downloads the plotted data.